Results
Wear: 25 hours of gripping, no detectable effect
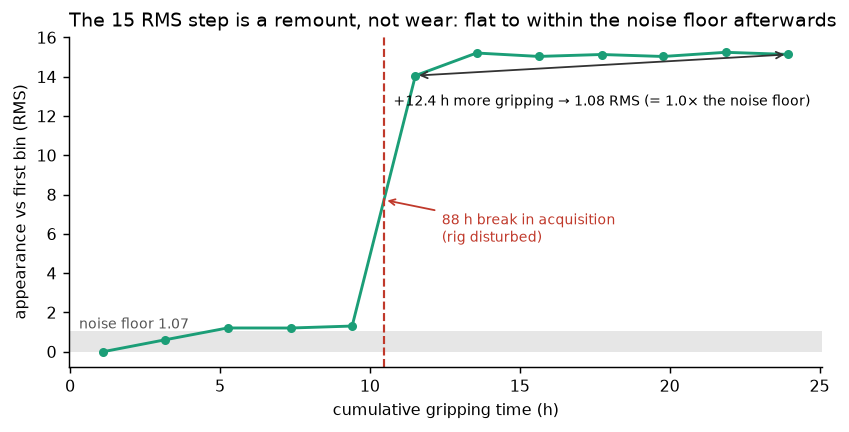 Appearance of the no-contact reference frames against cumulative gripping time. The entire step coincides with an 88-hour break in acquisition; afterwards the curve is flat to within the noise floor. wear_trend.json → ted_gel.series
Within continuous segments — the only place a slope is attributable to use —
only 3 of
7 beat a permutation
null, and most deltas sit below their own floor. The drift does not
accumulate across segments, so it is reversible per-session, not wear. LED warm-up
is the natural candidate but this data cannot separate it from ambient temperature
or gel creep, so no claim is made.
Does it hold on public data?
Finding 1 rests on a lab-internal campaign, so on its own it is a claim about
one rig rather than about GelSight Minis. Two public datasets were checked, using
their own reference frames and nothing from that rig.
 Ten public Sparsh sessions, advanced together. Sparsh has no clock, but each recording is an ordered sequence with an in_contact flag, so its no-contact frames give a within-session axis without one. Nine tiles hold still; the boxed one does not. Sparsh / TacBench · WebP 40 kB, GIF fallback 625 kB
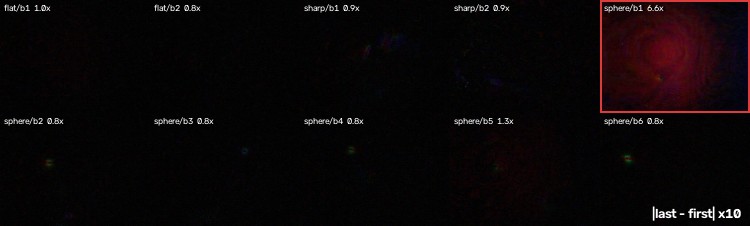 The same ten sessions as |last minus first|, amplified 10x because the real drift is small: 2.94 RMS against a 0.44 floor. Nine are nearly black, one glows. The amplification is applied identically to every tile, so the difference between them is not an artefact of it. Sparsh / TacBench · 23 kB
 FoTa, one finger, eleven capture days across 33, with the date burned in. Watch the jump between day 1 and day 21: those two are separated by a gap in acquisition, not by twenty days of use. Then watch how little the nine days after it move. FoTa_labeled, left finger only · WebP 27 kB, GIF fallback 224 kB
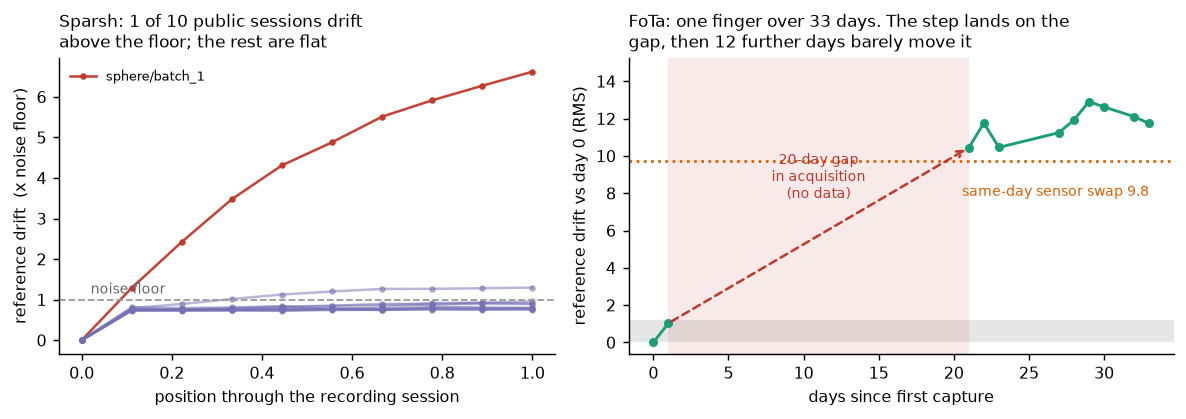 Left: Sparsh has no timestamps, but each recording is a sequence and ships an in_contact flag, so its no-contact frames form a within-session axis. One of ten public sessions drifts above the noise floor; nine do not. Right: FoTa filenames carry real capture epochs, giving one finger across 33 days. Sparsh / TacBench, FoTa_labeled
Both reproduce the shape of the in-house result. Sparsh: 1 of 10 sessions
drifts past the floor (6.6x), the other nine sit at 0.8–1.3x — the same
heterogeneity as the 3-of-7 segments in the durability run. FoTa: the appearance
steps at a 20-day gap in acquisition and then moves little across the twelve
capture days that follow, and the step is roughly the size of swapping to the
other finger on the same day (9.8 RMS). Neither dataset supports wear accumulating
with use; both support appearance moving when the rig is disturbed.
Watch it happen
Drag the slider. The red ticks are breaks in acquisition, not in gripping time.
The image jumps at a tick and then barely moves across the hours in between.
Markerless gel — 5.3 h. Most public force-labelled Mini data uses a
markerless pad, so this is the run to read first.
 The same run as a looping animation, 40 frames, with the elapsed gripping time burned in so the figure keeps its axis when it is copied out of this page. Served as WebP (96 kB); the GIF fallback (835 kB) is larger and shows contour rings, because 256 colours cannot hold a smooth gel gradient. panda_durability_test_data/0824_durability
Markered gel — 25.0 h, the longer run. Its 15 RMS step sits on the
88-hour break; the markerless run above instead shows a genuine rise inside
its second segment. The two runs disagree on how much within-use drift there is,
which is why neither is presented alone.
 The same run as a looping animation, 60 frames, with the elapsed gripping time burned in so the figure keeps its axis when it is copied out of this page. Served as WebP (247 kB); the GIF fallback (1285 kB) is larger and shows contour rings, because 256 colours cannot hold a smooth gel gradient. panda_durability_test_data/ted_gel
Per-segment table (n =
7 of
8; one segment of
1 frame excluded)
| seg | h | n | floor |
Δ | Δ/floor | rho |
perm p | beats null |
|---|
| 0 | 3.39 | 64 | 0.86 | +0.21 | +0.25× | +0.248 | 0.085 | — |
| 1 | 5.90 | 112 | 0.85 | +0.21 | +0.25× | +0.228 | 0.020 | yes |
| 2 | 1.00 | 20 | 1.14 | +0.38 | +0.33× | +0.347 | 0.340 | — |
| 4 | 3.31 | 63 | 1.14 | +0.19 | +0.16× | +0.155 | 0.215 | — |
| 5 | 5.90 | 112 | 1.06 | +1.54 | +1.45× | +0.699 | 0.000 | yes |
| 6 | 3.94 | 75 | 0.76 | +0.75 | +0.98× | +0.528 | 0.000 | yes |
| 7 | 0.84 | 17 | 2.10 | +0.24 | +0.12× | +0.206 | 0.545 | — |
The reference frame is the adaptation
Drag the divider. Same indenter, same load on both sides — only the sensor and its pad differ. This is the shift findings 2 and 3 are measured across. FEATS test_diff_sensor_old_gel / _new_gel · cylinder_8 at 12.19 N vs 12.19 N
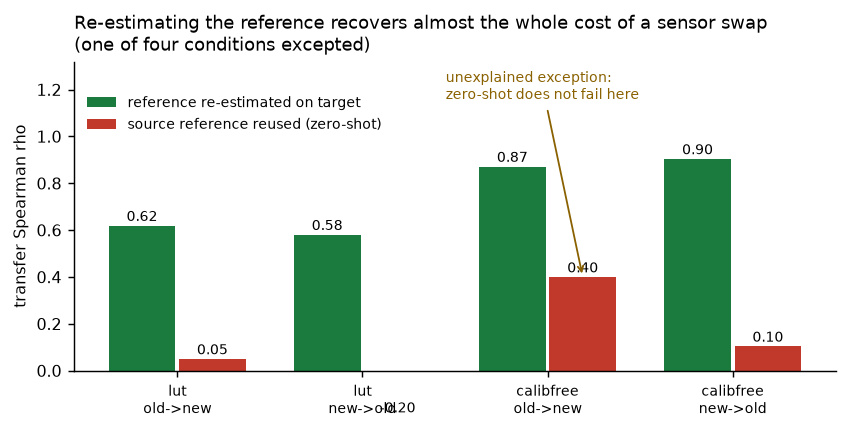 The same sensor+gel shift, scored two ways. Re-estimating the reference on the target domain (no force labels required) costs 1.5–5.5 %; reusing the source reference costs 70–95 % in three of four conditions. shift_vs_cost.json
After changing a pad or sensor, recapture reference frames. It is
unsupervised and recovers essentially the whole loss; skip it and physics-based
force estimation stops working.
An earlier version of this page reported one condition that broke the pattern —
calibration-free new→old surviving zero-shot at 0.93 — and flagged it
as unexplained. It was an artefact. FEATS stores its frames as RGB and they were
being read as BGR, so that comparison was measuring a channel swap rather than a
sensor change. With the channels corrected it falls in line with the other three
(0.10).
n = 1 shift throughout.
Frozen encoders, compared at a common feature width
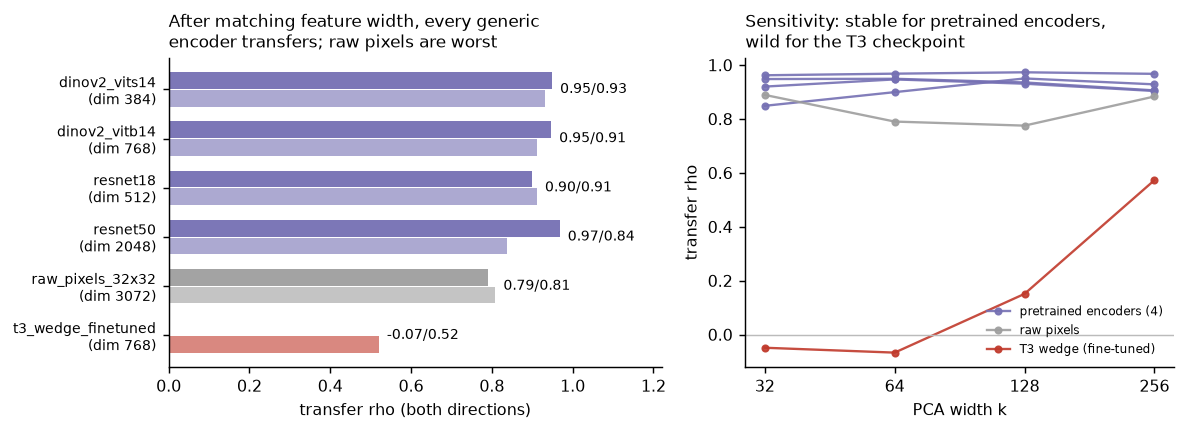 Left: transfer under a sensor+gel change, both directions, after PCA to a common width. Right: the same comparison across widths — pretrained encoders are flat, the fine-tuned T3 checkpoint is not. encoder_gap.json
What are the encoders for?
Nothing here trains a network. Each encoder is a frozen feature extractor:
a tactile image goes in, a fixed-length vector comes out, and only a small linear
map from that vector to force is fitted. The question is not "which model is best
at tactile sensing" — none of them has ever seen a tactile image in training. It is
narrower and more useful: does a general-purpose visual representation survive a
sensor change better than the physics pipeline does?
All four are ordinary computer-vision backbones, public and frozen, covering two
pretraining regimes: ResNet50/18 from supervised ImageNet classification, and
DINOv2 ViT-B/S from self-supervised training with no labels. They are the
encoders someone would actually reach for. Two references anchor the comparison. The
32×32 raw-pixel control has no learned representation at all, so it marks the
floor any encoder must beat. The T3 checkpoint is the one tactile-specific
model available here.
Read the table this way: every row is fitted and scored the same way, so a
difference between rows is a difference between representations, not between
methods. In-domain rho sits in a narrow band across all six while transfer does not
— so an in-domain number says nothing about robustness here. The T3 row is worst,
but it is a fine-tuned checkpoint rebuilt from its tensors with an unstable width
sweep; that is not evidence about the T3 method.
Does the shift predict the cost?
The same triangular indenter at the same load, pressed into a markered pad and a markerless one. Everything left over the divider is the gel model, which costs 11.9-23.5 in appearance and collapses transfer. FEATS / cnc_mini_26 · triangle_8 at 7.92 N vs 7.93 N
A second pair, a round indenter, same treatment. The dot lattice is not a detail on top of the signal — it dominates the image the estimator reads. FEATS / cnc_mini_26 · sphere_10 at 12.84 N vs 12.82 N
 The four force-labelled populations, cycled. Watch the dot lattice appear and vanish. That boundary costs 11.9-23.5 rms_lowfreq, but the widest gap here, 24.3, is between the two MARKERLESS sets: the marker pattern is not the only thing separating datasets. FEATS, cnc_mini_26, FeelAnyForce · 4 frames · WebP 19 kB, GIF fallback 99 kB
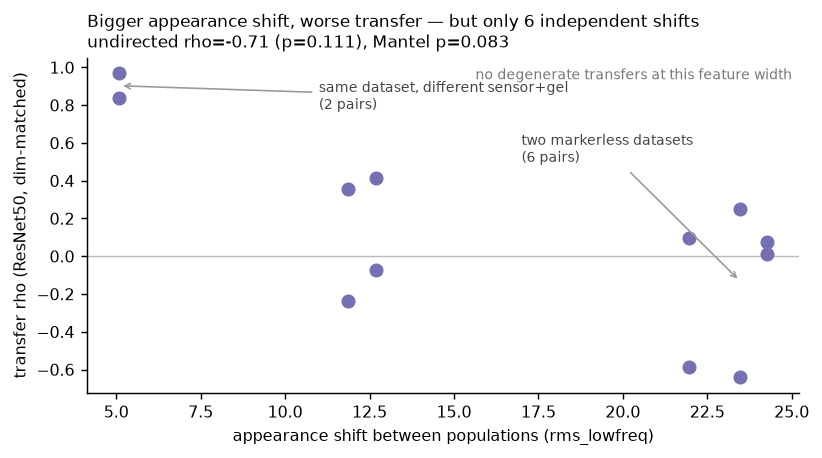 Transfer against appearance shift over four force-labelled Mini populations. Crosses are degenerate transfers (constant prediction), imputed as 0 and flagged rather than dropped. cross_dataset_gap.json
All 12 directed pairs (only
6
are independent shifts)
| pair | shift | ResNet50 |
raw pixels |
|---|
| feats_old->feats_new | 5.10 | +0.968 | +0.790 |
| feats_old->cnc26 | 11.87 | +0.358 | +0.060 |
| feats_old->faf | 23.47 | +0.252 | -0.442 |
| feats_new->feats_old | 5.10 | +0.838 | +0.809 |
| feats_new->cnc26 | 12.70 | +0.414 | +0.070 |
| feats_new->faf | 21.96 | +0.095 | -0.113 |
| cnc26->feats_old | 11.87 | -0.240 | +0.000* |
| cnc26->feats_new | 12.70 | -0.071 | +0.000* |
| cnc26->faf | 24.27 | +0.076 | +0.791 |
| faf->feats_old | 23.47 | -0.641 | +0.924 |
| faf->feats_new | 21.96 | -0.588 | +0.806 |
| faf->cnc26 | 24.27 | +0.013 | +0.742 |
* degenerate: the fitted map sends every target sample to one
value, so Spearman is undefined. Imputed as 0 and flagged — dropping them would
bias the summary toward the pairs that happened to work. Note 0 is not the worst
observed value (transfers reach
-0.64),
so the imputation is not neutral.
Recovering an unlabelled acquisition state from background colour
No dataset here labels force frames by sensor or pad. Background colour is set
by the LEDs and the gel, not by what is pressed — so it can recover the missing
state, but only measured on frames with no contact. Over the dataset's own
19 directories of genuine no-contact frames
the within-directory spread falls to
0.017 against a cluster
separation of 5.93 — a 340× margin.
| method | within-cluster, cross-object |
cross-cluster (recal) | cross-cluster (zero-shot) |
|---|
| LUT | +0.456 |
-0.268 |
+0.334 |
| calibration-free |
+0.915 |
+0.918 |
+0.938 |
Calibration-free reconstruction is unaffected; the per-sensor LUT degrades —
the prediction this task existed to test. But the smaller cluster holds only two
directories, the force histograms are not fully matched, and the LUT's
recalibrated score being worse than its zero-shot score is physically implausible
and remains unexplained.
Terms used on this site
| out-of-distribution (OOD) | Input that differs from what the estimator was fitted on — here: a different sensor, a different pad, or a different dataset. |
| reference frame | An image of the gel with nothing pressing it. Reconstruction works on the difference between a frame and this reference, so the reference carries the sensor's own illumination. |
| markered / markerless gel | GelSight pads either carry a printed lattice of black dots (used to read shear) or do not. It changes the image far more than swapping one pad for another of the same kind. |
| rms / rms_lowfreq | Root-mean-square pixel difference between two mean images, in 0–255 units. rms_lowfreq keeps only the smooth part — the only version that survives comparing images captured at different resolutions. |
| noise floor | What the statistic reads when nothing has changed: two averages of the same sensor, same pad. Any effect smaller than this is not measurable. |
| Spearman rho | Rank correlation, −1…1. It asks whether predictions ORDER the true forces correctly, ignoring scale — so it survives datasets with different force units. |
| in-domain vs transfer | In-domain: fit and score on the same population. Transfer: fit on one, score on another. The gap between them is the cost of the shift. |
| permutation null | The score the same procedure produces on shuffled data. Without it, a positive correlation can look meaningful when the procedure would produce one anyway. |
| Mantel permutation | A significance test for distance-vs-distance comparisons, where observations share populations and so are not independent. It relabels the populations instead of the observations. |
| LUT vs calibration-free | Two ways to turn an image into surface depth. The LUT (lookup table) is calibrated per sensor from known presses; the calibration-free solve is not, which is why the two degrade differently when the sensor changes. |
| degenerate transfer | The fitted map sends every target sample to one value, so rank correlation is undefined — total failure, not a missing measurement. |