Method
One statistic for how far the signal moves, one protocol for what
that costs. The two decisions below changed the answers more than any modelling
choice.
The appearance statistic
RMS pixel distance in uint8 between mean no-contact frames, 12 px
inset, plus per-channel medians. Fixed up front so it cannot be tuned after seeing
the answer.
The noise floor comes first — a distance between two means is meaningless
until you know what two means of the same cell give. Disjoint halves of
each cell's 100 repeats:
1.43 total /
0.28 low-frequency.
Decision 1 — across datasets, only the low-frequency part is comparable
Resizing to a common geometry and comparing total RMS is wrong, and was
falsified before any result existed: a resampling round trip attenuates a
white-noise-grade difference by ~40 % (7.88→4.71) while leaving a
low-frequency one invariant to 1e-4. Harmless only if wear were pure illumination
drift — it is 48 % low / 41 % high. So rms stays within one
dataset; rms_lowfreq goes across. A regression test pins this.
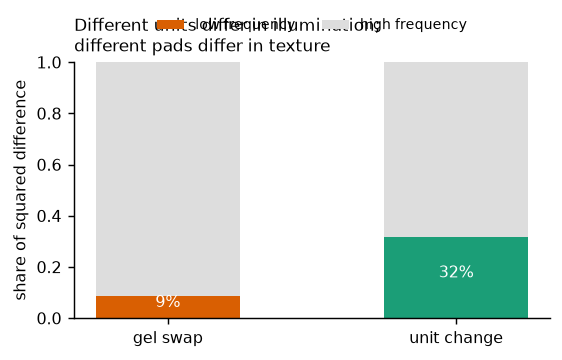 The two axes are physically different: units differ in illumination (low-frequency, global), pads differ in marker layout and texture (high-frequency, local). Consequence: any cross-dataset comparison systematically under-represents the gel axis. gel_axis.json → low_frac
Decision 2 — trends are fitted inside continuous acquisition segments
The campaign ran over four days with breaks up to 88 h, and appearance jumps at
exactly those boundaries — a trend fitted across one measures re-mounting. Records
are split at acquisition gaps before any slope, and drift is scored against a
permutation null, because the segment baseline contains frames that are
themselves scored, making Spearman positive even under zero drift.
Scoring protocol
Rank correlation via a shared scorer, self-tested each run (monotone >0.9,
shuffled <0.5). Transfer is always fit-on-source / apply-to-target explicitly,
paired with a matched-fit-size in-domain control. Encoder comparisons
project every feature set to a common width (PCA on the source only) and
report a k = 32…256 sweep — without it the comparison ranks output width, not
representation quality.
Retracted after independent review
Two adversarial review agents checked every number against the code and the raw
data. Four headline claims did not survive. Kept here because a results page that
only shows what worked is not evidence.
| retracted claim | why it failed |
|---|
| The encoder ranking reflected representation quality |
It ranked feature width. The scorer changes behaviour at p ≈ n_fit; holding
the feature type fixed and varying only width swings transfer rho +0.04 → +0.91, and
the old table was monotone in width. |
| “7/7 wear segments positive, p ≈ 0.008” |
The null is not centred on zero — the baseline contains scored frames. A
permutation null leaves 3
of 7 significant. |
| Gel axis = 16.35 |
FEATS gel index 5 is markerless, so a third of the pairs were a gel
model change. Corrected to
13.03, with the model change
reported separately at
27.19. |
| Shift-predicts-cost at p = 0.0033 |
12 directed pairs carry only
6
distinct shifts. Mantel permutation gives
p=0.083. |
Earlier retractions, and ideas rejected with numbers
Sparsh batch order. An earlier plan used sphere/batch_1..6 as a
sequential wear axis. All 39 pickles carry mtimes inside one 2-minute download
window; nothing on disk makes the index chronological. Usable only as an unordered
grouping.
“25 h wear ≈ one gel swap.” An invalid cross-resolution comparison
(640×480 vs 240×320, and wear is 41 % high-frequency). Withdrawn.
Background colour from random frames. Contaminated by contact: within one
directory the descriptor moves 3.35 RMS from lowest- to highest-force frames, the
same size as the “cluster separation” it produced. Replaced by the dataset's own
656 genuine no-contact frames, which cut the within-directory spread to
0.017.
Damage severity. Two criteria (frequency content and spatial
concentration) disagree across the two runs, and no dataset here carries a damage
annotation. No “damage” conclusion is drawn.
Data sources
| source | n | availability | role |
|---|
| FEATS no-contact grid | 3,000 | public |
5 units x 6 gels x 100 repeats, fully crossed and balanced |
| FEATS transfer splits | 393 / 395 | public |
the dataset's own sensor+gel shift, force-labelled both sides |
| Gel durability campaign | 464 refs |
in-house, unreleased |
25.0 h cumulative gripping on one Mini; finding 1 rests on it |
| cnc_mini_26 | 14,722 | in-house, unreleased |
markerless, force in filename |
| FeelAnyForce | 13,589 | public |
markerless, 6-axis wrench |
| TacQuad (Mini only) | 24,866 | public |
cross-domain; no force labels, contact windows only |
Two of the six are lab-internal collections with no README, licence or release,
so findings 1 and 4 cannot be reproduced from public sources as they stand. Every
figure drawn from them names its directory.
Terms used on this site
| out-of-distribution (OOD) | Input that differs from what the estimator was fitted on — here: a different sensor, a different pad, or a different dataset. |
| reference frame | An image of the gel with nothing pressing it. Reconstruction works on the difference between a frame and this reference, so the reference carries the sensor's own illumination. |
| markered / markerless gel | GelSight pads either carry a printed lattice of black dots (used to read shear) or do not. It changes the image far more than swapping one pad for another of the same kind. |
| rms / rms_lowfreq | Root-mean-square pixel difference between two mean images, in 0–255 units. rms_lowfreq keeps only the smooth part — the only version that survives comparing images captured at different resolutions. |
| noise floor | What the statistic reads when nothing has changed: two averages of the same sensor, same pad. Any effect smaller than this is not measurable. |
| Spearman rho | Rank correlation, −1…1. It asks whether predictions ORDER the true forces correctly, ignoring scale — so it survives datasets with different force units. |
| in-domain vs transfer | In-domain: fit and score on the same population. Transfer: fit on one, score on another. The gap between them is the cost of the shift. |
| permutation null | The score the same procedure produces on shuffled data. Without it, a positive correlation can look meaningful when the procedure would produce one anyway. |
| Mantel permutation | A significance test for distance-vs-distance comparisons, where observations share populations and so are not independent. It relabels the populations instead of the observations. |
| LUT vs calibration-free | Two ways to turn an image into surface depth. The LUT (lookup table) is calibrated per sensor from known presses; the calibration-free solve is not, which is why the two degrade differently when the sensor changes. |
| degenerate transfer | The fitted map sends every target sample to one value, so rank correlation is undefined — total failure, not a missing measurement. |